Technical Analysis of the "Every GPU That Mattered" Visualization
The "Every GPU That Mattered" interactive map attempts to document thirty years of graphics hardware evolution, from 1996 through the current 2026 Blackwell era. Hosted at sheets.works, it is currentl

The Pitch
The "Every GPU That Mattered" interactive map attempts to document thirty years of graphics hardware evolution, from 1996 through the current 2026 Blackwell era. Hosted at sheets.works, it is currently circulating among the engineering community for its high-fidelity data visualization of MSRPs and performance shifts (Source: HN).
Under the Hood
The "Every GPU That Mattered" interactive map tracks thirty years of graphics hardware but contains significant technical inaccuracies regarding architectural milestones and game compatibility (Source: HN). While the UI is polished, historical archivists have flagged several errors that undermine its utility as a reference tool.
The visualization incorrectly pairs the AMD RX 5700 XT with the game Control. While Control served as a primary industry showcase for Ray Tracing, the 5700 XT lacked the hardware RT support required to run the title's flagship features (Source: HN April 2026). This is a fundamental misunderstanding of the hardware's functional capabilities.
Historical accuracy is further compromised in the early-era data. The project credits the 3dfx Voodoo 1 with the first hardware-accelerated Quake launch, yet technical archives confirm the Rendition Vérité 1000 was the first card to run vQuake in 1996 (Source: Fabien Sanglard). 3dfx remains the sentimental favourite, but the data should reflect the actual release sequence.
Regarding current hardware, the project includes the RTX 5090 (Blackwell), which launched in early 2025. This unit features 32GB of GDDR7 and established a 50% performance delta over the RTX 5080—the widest gap between a flagship and the tier-two card in the history of the industry (Source: Boxx/CG Channel Dec 2025).
However, we don't know the normalization methodology used to compare performance across three decades of evolving APIs. There is no explanation of how a card using the Glide API in 1997 is weighed against a Blackwell unit running Vulkan in 2026. Furthermore, the dataset omits the 2021-2024 "Scalper Era" price volatility, relying on MSRPs that did not exist in the actual market.
Marcus's Take
This is a marketing asset disguised as a reference tool. The host, sheets.works, is a design agency that explicitly advertises "building visual stories for companies," which likely explains why the data prioritizes aesthetics over technical rigour (Source: sheets.works/data-viz/hire). It completely ignores the Datacenter sector—H100 and B200 units—which has defined the industry’s valuation for the last three years. If you want a nostalgia trip for your desktop background, it is fine, but do not use these charts for actual benchmarking or historical research.
Ship clean code,
Marcus.
Marcus Webb - Senior Backend Analyst at UsedBy.ai
Related Articles
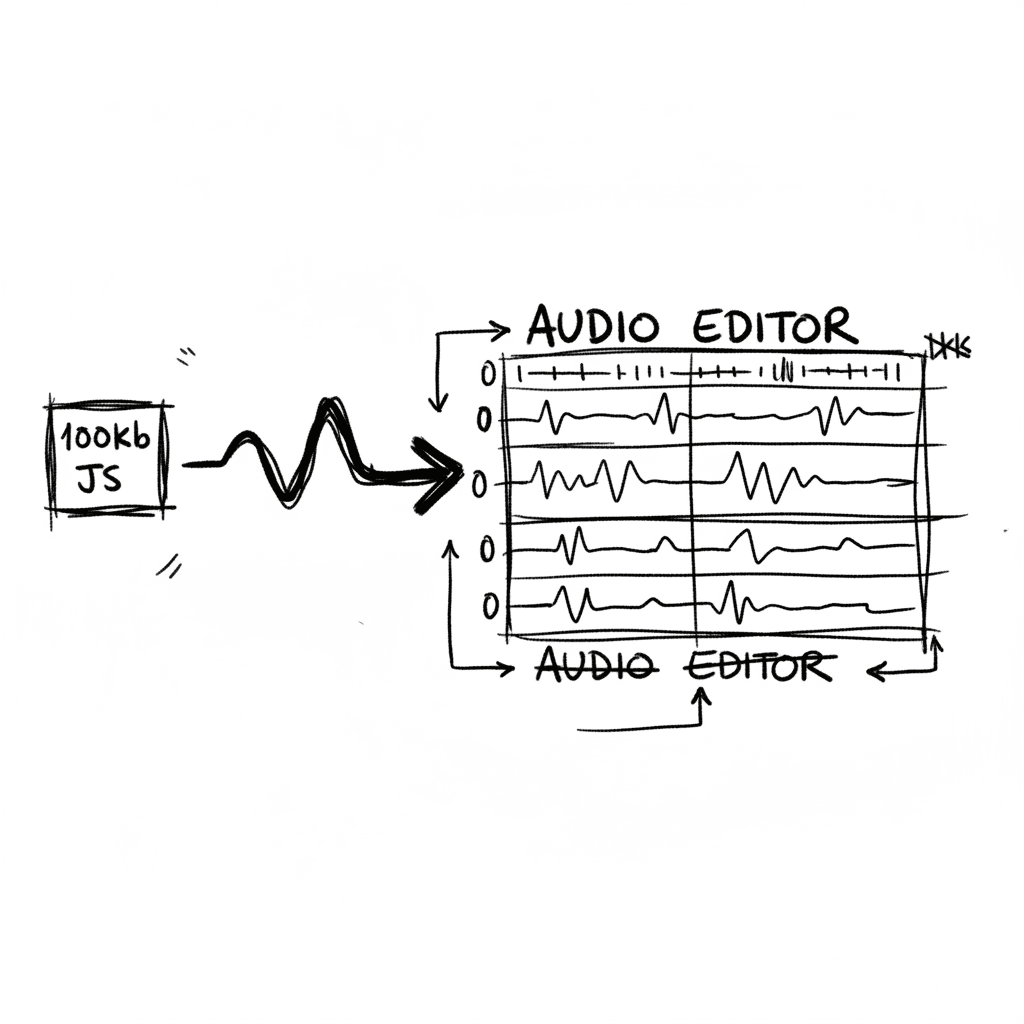
Audiomass: Multitrack Audio Editing via 100kb of Vanilla JavaScript
Audiomass is a browser-based, multitrack audio editor that operates entirely client-side with a remarkably small 100kb footprint (audiomass.co). It provides a workflow reminiscent of classic editors l
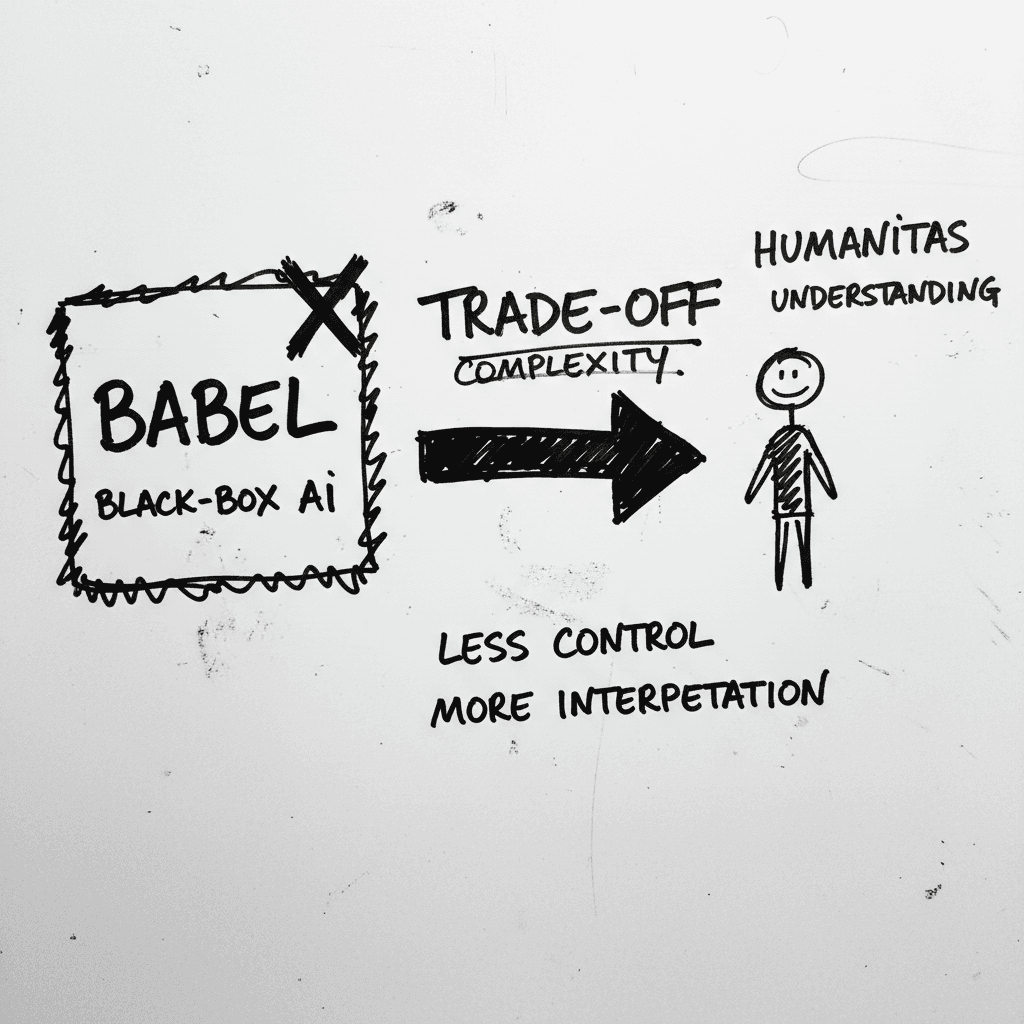
Magnifica Humanitas: The Vatican’s Framework for the GPT-5 Era
The document, signed May 15 and officially released today, was presented at the Vatican alongside Christopher Olah, co-founder of Anthropic and lead of its interpretability team (ncronline.org, Forbes

The Zero-Click Economy: Kagi Search vs. Google AI Mode
Google has effectively pivoted to an "answer engine" where Gemini 3.5 Flash provides conversational summaries, while Kagi remains the primary refuge for users seeking a human-centric, ad-free index. W
Stay Ahead of AI Adoption Trends
Get our latest reports and insights delivered to your inbox. No spam, just data.